The Housing Industry Association (HIA) released its quarterly housing affordability index for the December quarter of 2012, which registered another solid improvement.
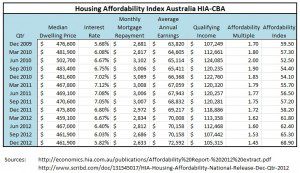
This chart shows the changes in Housing Affordability in Australia from December 2009 to December 2012.
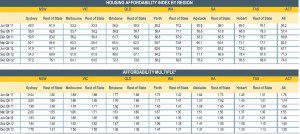
The following chart shows the December 2012 Australian Housing Affordability Index, for each of the Australian states, from the HIA-CBA Housing Affordability Index.
From the Media Release:
Housing affordability surged again in the December 2012 quarter, driven by earnings growth, interest rate cuts and weak price developments, said the Housing Industry Association, the voice of Australia’s residential building industry.
The HIA-CBA Housing Affordability Index increased by 5.5 per cent in the December 2012 quarter, representing an 18.4 per cent advance on the same period of 2011.
“This is the eighth consecutive quarter of increase in the index, bringing it close to levels not seen since the depths of the GFC during 2009,” said HIA Senior Economist, Shane Garrett…
“Despite the relative attractiveness of house purchase implied by these figures, transactions activity on the ground is very sluggish. This underlines the need for stronger interventions from the RBA in terms of interest rates and from the government with regard to the heavy taxation of home purchase”.
The HIA-CBA Housing Affordability Report recorded improved affordability in all seven capital city indices as well as improvements in the six indices tracking the non-metro regions of each state…
Full Report
HIA Housing Affordability National Release Dec Qtr 2012 by leithvanonselen
393.1 - 841,738

