London Stock Exchange FTSE 100..
The following numbers show the value of the FTSE 100 each year on, or near, this day (Oct 27) from 2011 to 2017
5,713.82 Oct 27, 2011
5,795.10 Oct 29, 2012 (Up 1.42% in One Year)
6,774.73 Oct 29, 2013 (Up 16.9% in One Year)
6,402.17 Oct 28, 2014 (Down 5.5% in One Year)
6,365.27 Oct 27, 2015 (Down 0.58% in One Year)
6,958.09 Oct 27, 2016 (Up 9.31% in One Year)
7,505.03 Oct 27, 2017 (Up 7.86% in One Year)
The FTSE 100 value at the time of the BREXIT referendum, with one month before, and one month after were:
6,136.40 May 23, 2016 (One Month Before Brexit Vote)
6,338.10 June 23, 2016 (Brexit Vote)
5,982.20 June 27, 2016 (One week After Brexit Vote)
6,730.48 July 22, 2016 (One Month After Brexit Vote)
The FTSE went up by 9.68% in the two months around Brexit. (May 23 to July 22)
The Lowest and Highest values for the FTSE in the 12 months before 27 Oct 2016
5,536.97 on February 11, 2016
7,097.50 on October 10, 2016
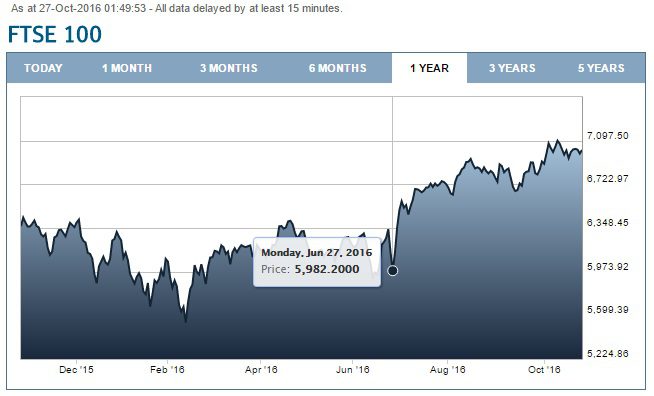
Source of Chart and Data: www.londonstockexchange.com
86.1 - 841,730